


Indicators you can use for ES Futures
Post is from 11.29.22
Hey guys, I wanted to share with you a trade set up and what indicators I am keeping an eye on.
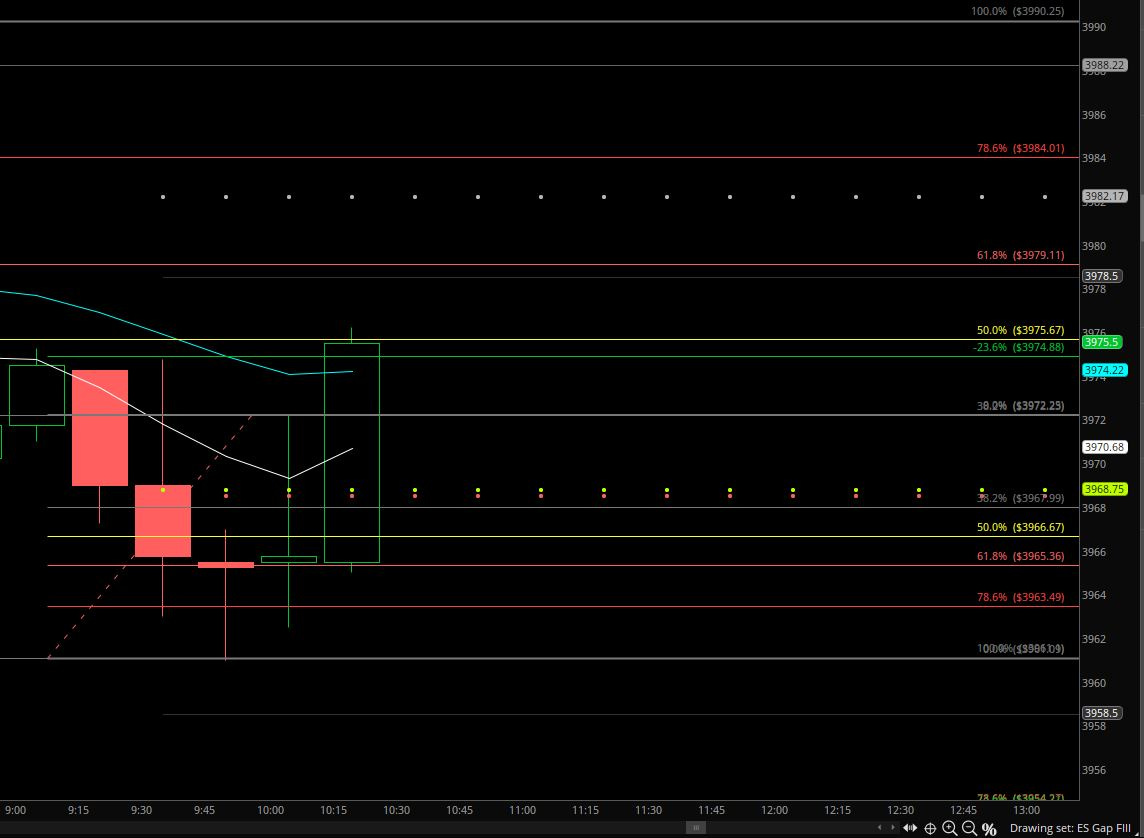
Here is a picture of the market after the open. I drew up 9:45am lows to 10am highs. Look into Fibs more if you’re interested, but I was looking for an entry long at 3966 with a stop at 3962. I got filled with 4 contracts and took 2 off at 3970 and one at 3974. There was an opposing move down that turned out to be good resistance for a bit. The fourth one I kept as a runner and was stopped out at breakeven. Not a big trade, but for me that’s what I am looking for to keep building momentum. 16 points or $800 on one trade.
So as I look to get into a trade, there are several indicators I am monitoring. I am looking for support or resistance in volatility; volume profile auction and path of least resistance; Daily Pivot and Gaps; Tick Chart; NYSE Breadth, Bank, the Dollar, and some of the leading stocks in the S&P. For our paid subscribers, the article will continue below and I will go into more detail how to use each indicator and what I am looking for out of each one.
Let’s look at each indicator separately. This is in no way exhaustive, feel free to do your own research, but it has been helpful in keeping me on the right side of the trend. Much of my indicator work comes from eminiaddict, he is a great educational resource.
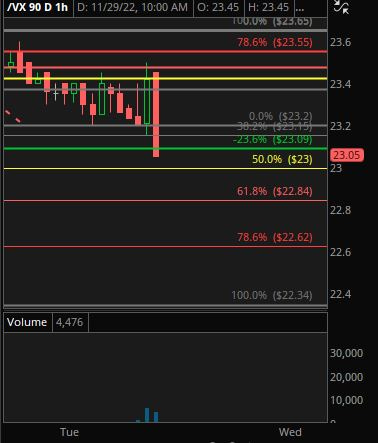
VIX Futures: Using Fibs, I am looking for the VX to be running into support if I am shorting the ES, or resistance if I am going long in the ES. This goes for the other indices as well. When I entered my trade yesterday, the ES was bouncing off of support while the VX was running up into resistance.
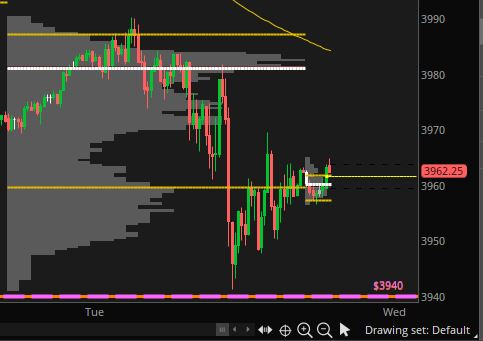
Volume Profile: I am not really an order flow trader, but once I am in a trade, I use volume profile to give me confidence to hold onto winners. For example, we had fib resistance around 3980 (See image ES Setup above). Volume profile showed some resistance around that area as well. So if you had shorted ES around 3980 (there was resistance there), you may have had confidence to hold onto your short at least until 3960s as there was not much volume in that direction.

If you took partial profit and left a runner at 3960 you would have been able to ride this for another 10-15 points until the auction dried up at the 3941 level. There was also a Fib retracement level at 3941, so it all combined to help make for nice profit taking opportunities.
Tick Chart: I am looking at whether we are making a high tick or a low tick. I am selling high ticks and buying low ticks. The Tick chart is the difference between the number of stocks currently ticking up and the number of stocks currently going down. I am looking for extreme ratings. Plus or minus 400, plus or minus 700, plus or minus 1000. Over/under 1000 is quite an extreme reading.
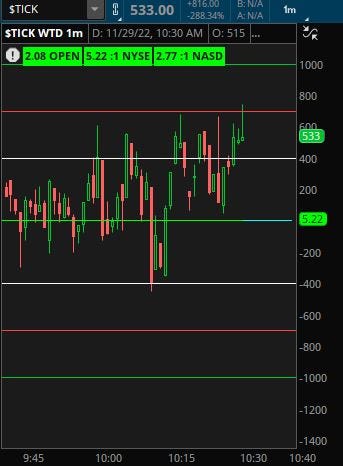
NYSE Breadth: The relationship between the number of stocks climbing versus the number of stocks declining. It is shown in a ratio above as 2.08. Anything positive would lead us to look for a long, anything below zero would indicate more selling pressure. We look at Breadth at the open, and Breadth after the open to see if it is increasing or decreasing as this helps to paint a picture of where we are headed. Look in the ThinkorSwim (TOS) help center for the Breadth study or I am happy to share my chart with you. In this example, Breadth was above 1, so I was happy to be in a long.
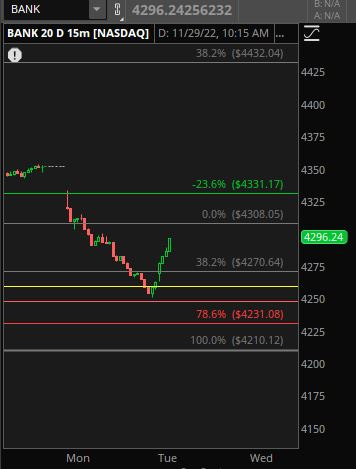
Bank: I use Bank to help me understand the direction of the general market. If the ES is decreasing but Bank is rising, I trust Bank. If Bank is declining and the ES is increasing, I again trust bank. You want Bank and the indices to align. This helps you hold onto winners. Here you can see Bank increasing at the time of my long.
The Dollar: I use USD/JPY to measure the strength of the dollar. When the dollar rises, we are seeing a dollar strength trade and the indices and currencies will usually go in the opposite direction. So, when I am going long in the ES, I am looking for the dollar to hit resistance. You can see in this example, we ran right up into resistance near 138.

Top 5 Indicator: I learned this from TicTocTrading. In ThinkorSwim (TOS), you can add any stocks together to see what their composite price action looks like. The general rule of thumb is to use this as a confirmation of direction. If we are around 0, +1% or -1% on the day, this is a pretty neutral day and we may not seem much volatility. If we are past +2% or -2%, I will not fade these readings. For example, if we are up +2% or more, I will not short the ES unless I see that decreasing. If we are at -2% or more, I will not open a long either. When we see bigger percentages like -4% or -5%, or +4% or 5%, you can use this to be on the right side of the trend day and know that any pullback may be bought on a green day or any bounce into resistance may be sold into.
These are just the indicators that I use. I am sure there are many others that can be helpful, but I have found these to be enough for me to make informed decisions in the context of the trading day. Nothing is 100% but it does give you a better probability of getting a free trade so that at the very least you are stopped out at breakeven.
For my next few posts, I plan to cover in more depth Fibonacci retracements. If you’re interested I would recommend reading the book “Trading the Measured Move” by David Halsey as my Fib work comes from the education I received from him for the past 3 years.
Let me know if you have any questions on that and I will be back for more next time!